

This feature automatically converts modules, subprograms, and hierarchical processes in the DIATwin Gantt chart into a standardized hierarchical JSON data structure based on the timeline and operation records, ensuring complete consistency with the original visual presentation. This automation mechanism not only significantly replaces the tediousness and error risks of manually organizing flowcharts but also transforms simulated processes into traceable and analyzable digital assets, supporting cross-platform integration (such as MES, data analysis systems), allowing engineers to accurately decompose modules, compare performance, identify bottlenecks, and thus promote process optimization, truly achieving process transparency, intelligent management, and maximization of data value.
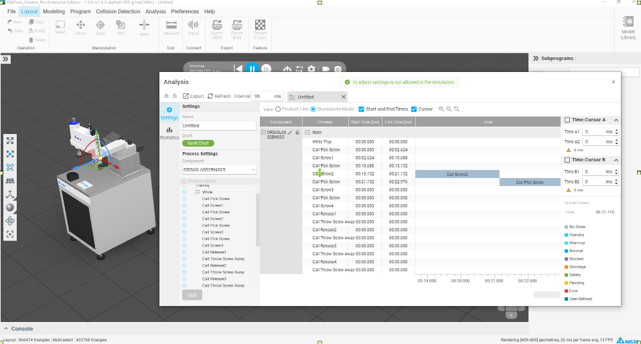
Operation Instructions:
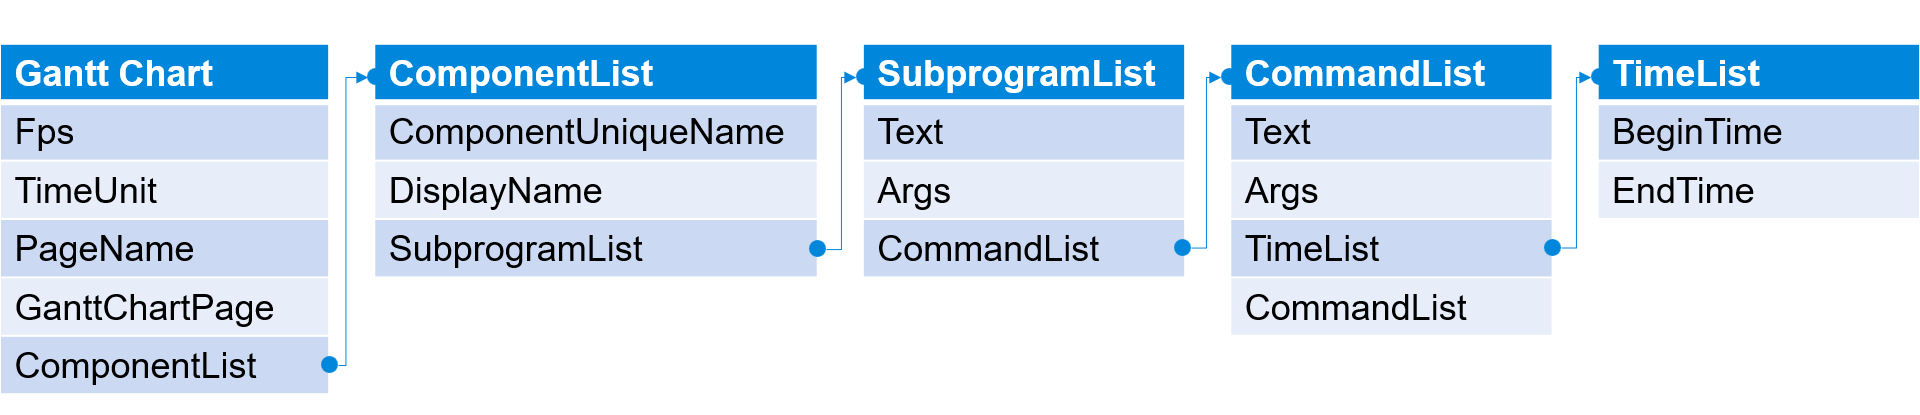
Explanation Table for Gantt Chart Output Structure (GanttChart JSON Explanation)
| Field Name | Data Type | Description |
| Fps | Float | The frame rate of the Gantt chart, determining the update frequency of the time coordinates and animations. |
| TimeUnit | String | The time unit used, defaulting to milliseconds ("ms"). |
| PageName | String | The name of the Gantt chart page, for example, "Untitled". |
| GanttChartPage | Object | The main data object, containing the controller and its scheduling information. |
| ComponentList | Array | A list of controllers selected for recording, each corresponding to a row on the Gantt chart. |
Explanation of ComponentList Fields
| Field Name | Data Type | Description |
| ComponentUniqueName | String | The unique identifier name (UUID) of the controller. |
| DisplayName | String | The display name of the controller in the UI. |
| SubprogramList | Array | Describes the subprogram objects to be recorded under this controller. |
Explanation of SubprogramList Fields
| Field Name | Data Type | Description |
| Text | String | Describes the display name of the subprogram to be recorded in the UI, such as "Main", "Subprogram-XX". |
| Args | String | The parameter string passed, this field stores status descriptions or command details. |
| CommandList | Array | Describes the list of recorded Statements, which can recursively include sub-Statements (nested Statements structure). The top level records the first-level content of Statements (e.g., "Initial Pose", "while"). |
Explanation of CommandList Fields
| Field Name | Data Type | Description |
| Text | String | Describes the command type under the specified Subprogram. For example, "Call", "PTP", "While", etc. |
| Args | String | The parameters passed to the command, formatted according to the command type definition. For example, the name of PTP, the name of the State, etc. |
| TimeList | Array | A list of time intervals indicating the start and end times of this command. Supports multiple executions (e.g., the time of procedures recorded repeatedly under while). |
| CommandList | Array | Nested commands; if the specified Text has subprograms, the program content is recorded. |
Explanation of TimeList Fields
| Field Name | Data Type | Description |
| BeginTime | Integer | The start execution time of the command (in units of TimeUnit, unit in milliseconds). |
| EndTime | Integer | The end execution time of the command (in units of TimeUnit, unit in milliseconds). |