

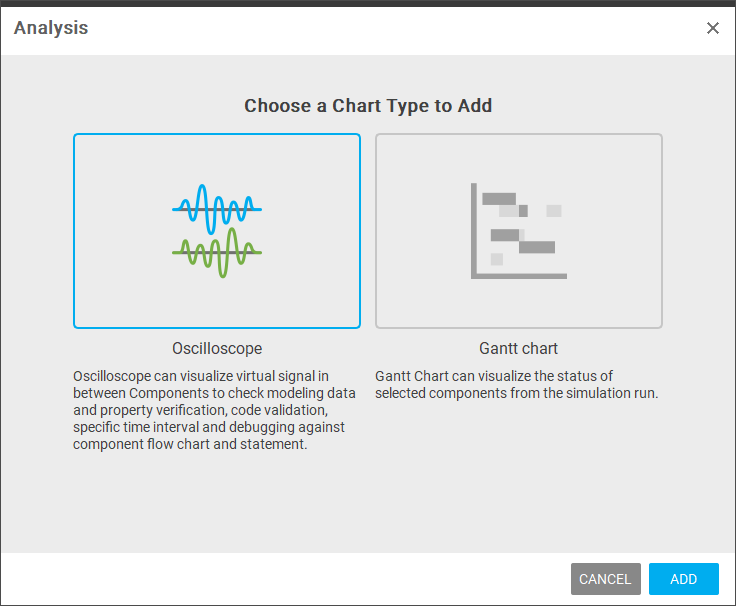
Currently, DIATwin provides two types of analysis tools
Oscilloscope:In the oscilloscope, the user can select the joints or channels of the emitter and receivers that want to be measured. When a signal is generated, the oscilloscope chart will display high or low voltage levels. By observing the chart, the user can determine if the machine is operating normally
Gantt Chart:The user can select the low-code statements that need to be recorded in the program editor. When the simulation starts, the Gantt chart will begin recording the duration of the statements, allowing the user to observe the cycle time of the machine operation